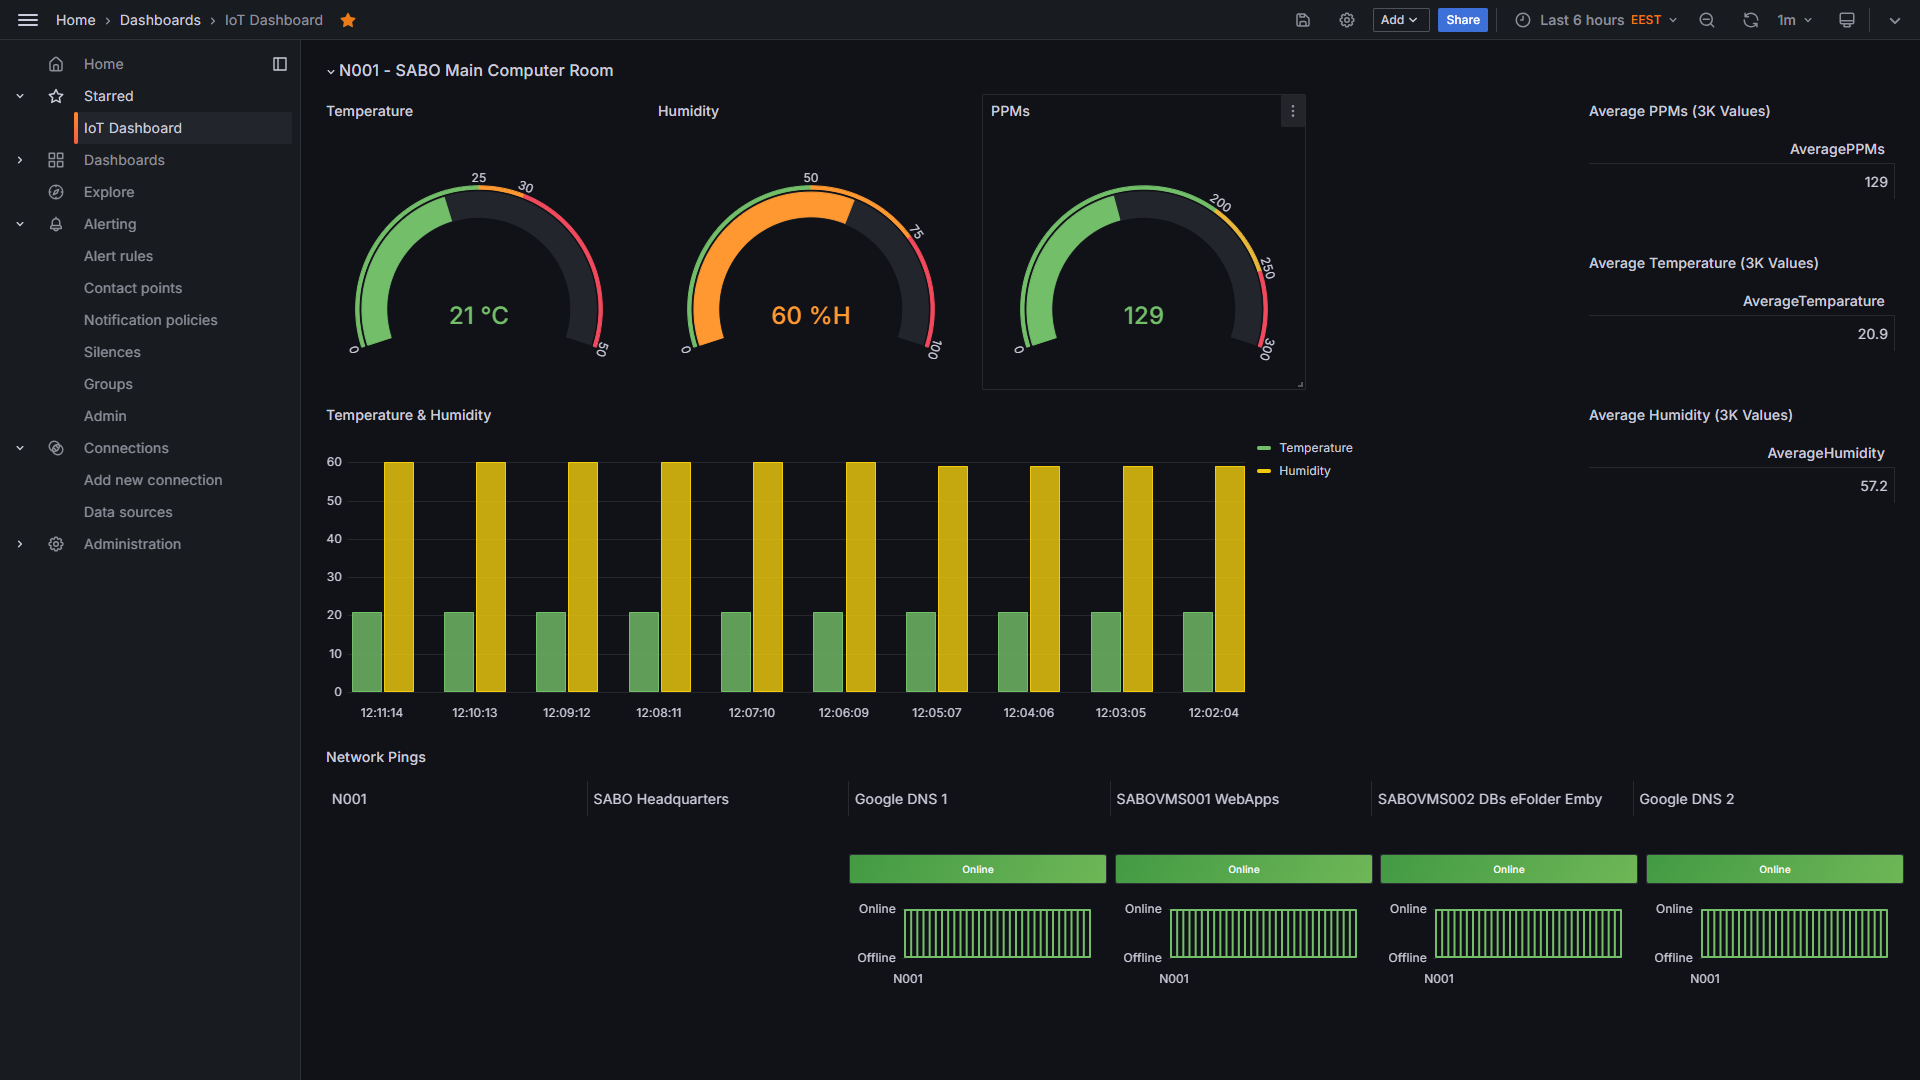
We offer and customize Grafana for visualizing IoT data, providing real-time insights and interactive dashboards tailored to your needs. Our solutions enable seamless integration with IoT devices, ensuring clear, data-driven decision-making. With our expertise, you can monitor key metrics, optimize performance, and enhance operational efficiency using powerful Grafana visualizations.
Using Grafana for IoT data visualization offers numerous benefits, including real-time monitoring, improved decision-making, and enhanced operational efficiency. Its interactive dashboards provide clear insights into system performance, helping businesses detect issues early and optimize resource usage. With customizable alerts and seamless integration with various data sources, Grafana enables better predictive maintenance, reduces downtime, and improves overall productivity. Its user-friendly interface ensures that both technical and non-technical users can easily interpret data and make informed decisions.
Implementing Grafana for IoT data visualization can be a game-changer for any organization, providing real-time insights that drive smarter decision-making. By centralizing and visualizing critical data, businesses can monitor equipment performance, detect anomalies, and optimize operations more effectively. This leads to reduced downtime, improved resource management, and increased efficiency. Additionally, with customizable dashboards and automated alerts, teams can proactively address potential issues before they escalate. Investing in this solution empowers organizations to enhance productivity, reduce costs, and stay ahead in an increasingly data-driven world.